Beware of the Writing on The Wall – Part 2 - Enter The Crash
By Mike Fortunato, CIM®, FCSI®

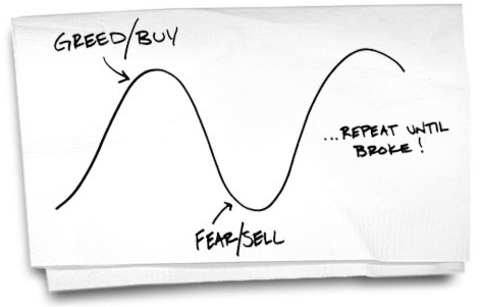
image: http://theholyfinancier.com/beat-the-herd-mentality/
It was the early summer of 2007; I had just started my new job as a bank teller and had begun building relationships with my branch’s many regular customers. Our diverse customer base contained a wide spectrum of investor profiles whose experience ranged from starter to sophisticated and whose risk appetite ranged from skeptical to speculator. One thing they all had in common however, was that they were complete unaware of the looming Financial Crisis that was just around the corner. During those first few weeks, while settling into my new role, I recall that all the posters on our display wall contained what I would describe as boring advertisements of our various account types and fee structures. One day this all changed when a new poster became the centerpiece of our five-poster spread. I remember this all very clearly because this was the first time any client had ever asked me for more information about one of our posters. And for several weeks after its arrival that poster became the catalyst for many eye-opening conversations between myself and the inquisitive clients who just “had to know more” about it. What was on the poster? It was an advertisement for one our equity mutual funds. I actually don’t even remember the name of the fund. To be honest, however, it wasn’t the mutual fund’s name that had piqued the client’s interest. I’m certain of this because the only part of the poster any client ever inquired about were the three, double-digit, numbers centered on the poster in large, bright, bolded font under the corresponding headings of: “1-Year Return, 3-Year Return & 5-Year Return”.
The information presented on that poster was not an exaggeration. That particular equity mutual fund actually did deliver double-digit, annualized returns to its unit-holders for the past several years. But beyond eliciting a Pavlovian response, that information is of almost no use to an investor who understands the cyclical nature of markets. To be clear, I’m not saying that the bank was attempting to manipulate its customers through Bernaysian persuasion; in fact, anyone with a magnifying glass could clearly see that “past performance wasn’t indicative of future returns”. It is important to note that at the time I also had personal accounts at two other Big Five competitors and often visited their branches to conduct personal business. During those visits I observed that they too were usually displaying posters that advertised the same investment products as my bank. While their poster’s colour scheme was different than ours, the content displayed was usually quite similar.
A major component of my role as a teller was to refer clients who were interested in our products to our branch’s advisors for more information. Needless to say, my referrals really picked up the day we began displaying the past, double-digit returns of that equity mutual fund. Before introducing them to our advisors, our interested clients would often ask me a few cursory questions about the mutual fund and although I wasn’t in a position to answer many of their questions (for regulatory reasons) I did glean some insights into the mindset that they entered the advisor’s office with. As someone who had already been studying Behavioural Finance for the past few years, it was very easy for me to conclude from the nature of their questions that they were operating from a mindset tilted more towards greed verses fear. Of the dozens of clients that were interested, only a handful ever asked me about the risks involved with such an investment, and the vast majority were mostly concerned with seeing proof of the past performance, which was quite easy for our advisors to provide them. The only fear I ever detected came in the form of “fear of missing out” rather than fear of loss. It is important to also remember that, at the time, the market had been in an uptrend for the past several years and one only needed to flip to any financial news TV station to see the anchors proudly boasting that broad market indexes were too showing double-digit historical returns. I’ll never forget my favourite customer; an upbeat older gentleman who would visit our branch on an almost daily basis to give me his stock picks for the week. When I probed him as to why he liked those tickers he would parrot to me the target-price he saw online that morning as if the company was destined to trade at that exact price in the near future. While the mood during this time in history wasn’t quite the “irrational exuberance” that Greenspan had observed a decade earlier it certainly was an exciting time to be in the markets.
It wasn’t a mere coincidence that the arrival of the poster showcasing double-digit, historical returns came just a few weeks prior to the top of the market. This is actually quite normal and has less to do with some secret bank conspiracy and more to do with basic math and market dynamics. You see, markets (like the stock, bond or real estate markets) tend to move in a cyclical fashion. Generally speaking, over very long time periods, markets usually tend to move in a positive direction, however, over the medium & short-term we tend to see prices oscillate between peaks and troughs. Using price data all the way back to 1956, we can see that there were 12 stock market cycles in Canada and 11 the USA (peak to peak including our current bull-market). During that time, the average bull-market lasted 52 months and 48 months respectively while the average bear-market only lasted 9 months and 14 months respectively. But as the two graphs below illustrate, we can see that the duration of the average bull-market has increased significantly in more recent history (from 1980 till present). It would appear that more modern bull-markets tend to last somewhere between five and ten years in both Canada and the USA.
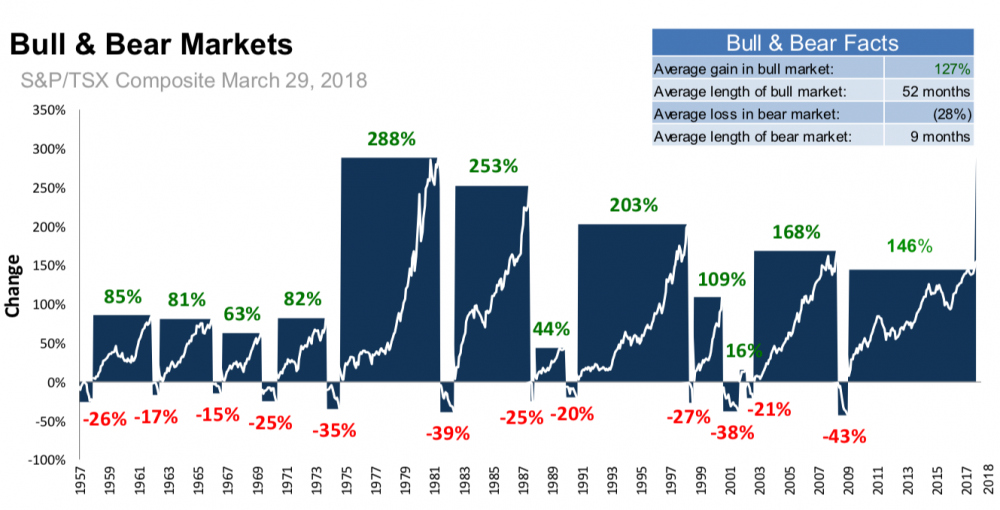
 Source: mackenzieinvestments.com Original Source: Bloomberg March 2018
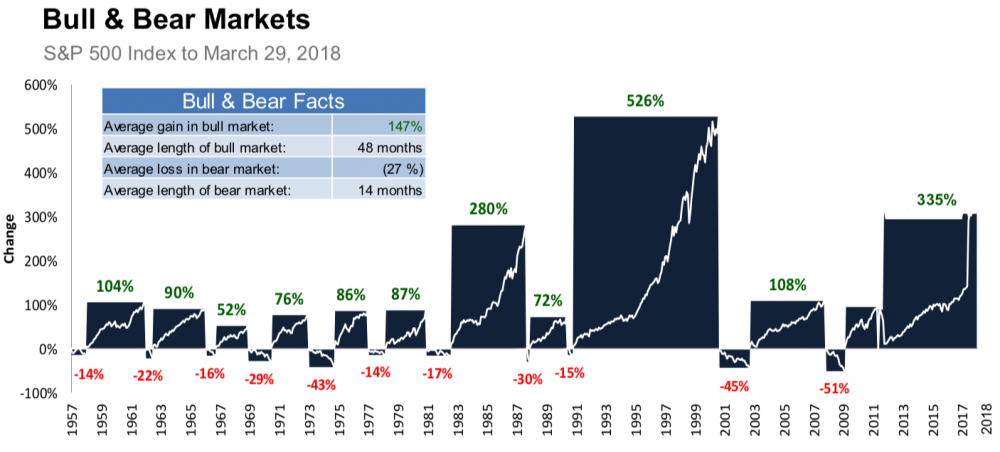
As we can see, the return from equities is far from steady. Over the long-term we can forecast growth, however, that growth is traditionally delivered in waves that last between five and ten years. This is why it is incredibly dangerous to rely on historical growth (especially when measured in 3-year & 5-year rolling periods) to predict where the markets will go in the near-term. Mathematically speaking, if a market rises for five years or more before falling, then that market’s 5-year historical return will be at its highest level precisely at the moment before it is about to crash.
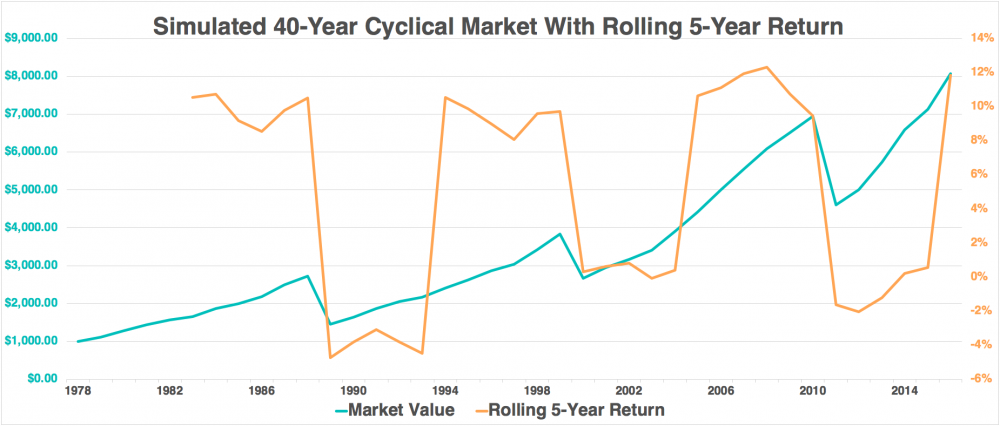
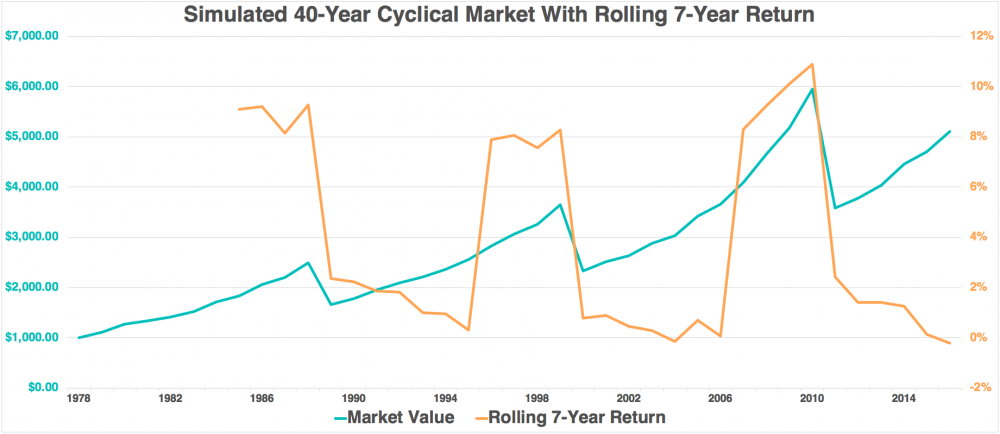
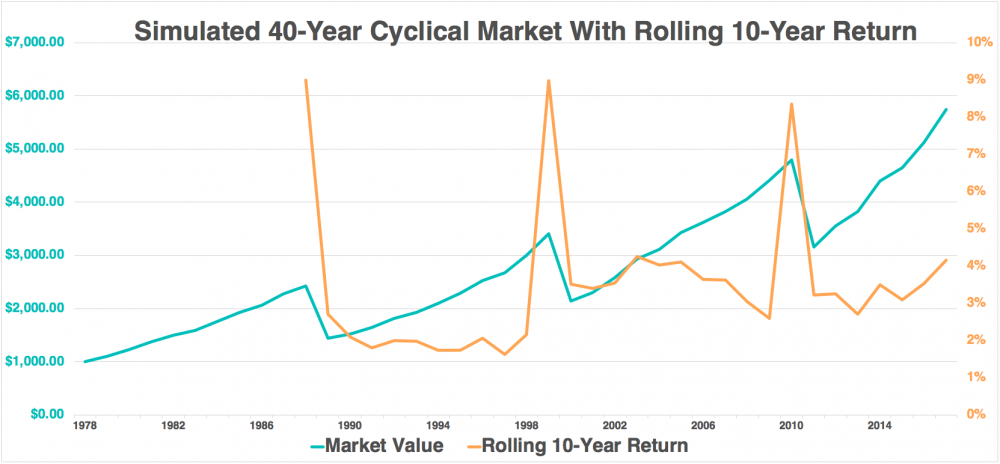
To illustrate this point, I’ve created a theoretical market price series that runs for 40 years. The price of this series (the blue line) starts at $1000 in 1978 and ends at $4448 in 2018. The market follows a simple, random progression where it increases for seven straight years with each year’s increase being randomly generated between 5% and 15%. Then, on each eighth year, the price decreases by a random amount between 30% and 50%. This creates a 40-year market price series (with repeating cyclical periods of eight years) and has an average annualized total growth of about 4%. If we add in a 2% dividend, we have a somewhat realistic model to work with.
On top of this price series I’ve overlaid its rolling 5-year return, rolling 7-year return & rolling 10-year return in orange (in three separate graphs). As you can see, the historical 5-year, 7-year & 10-year return is at or close to its peak precisely as the market, in blue, is about to start falling. There is one other noteworthy observation: according to this chart, the best times to buy this market also happened to be when the rolling 5-year, 7-year & 10-year historical return was at or near its lowest points. In some cases, the rolling, historical return was actually negative even though the market had bottomed and was about to rise for seven consecutive years.
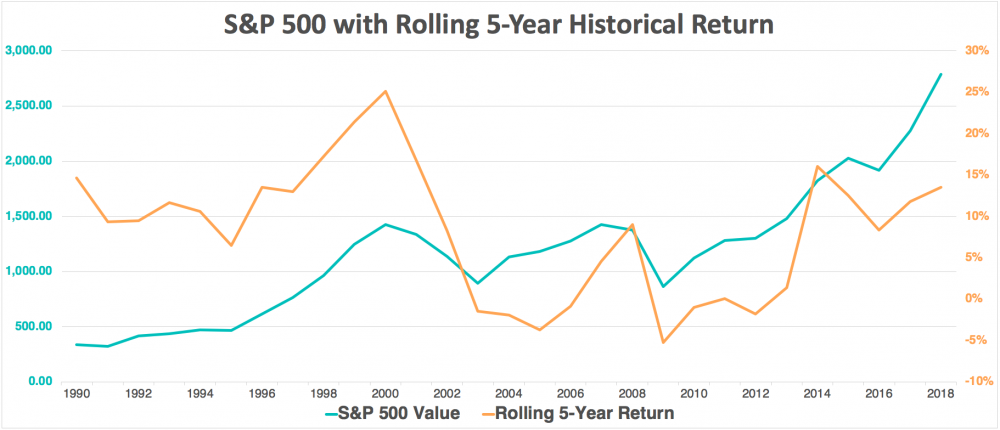
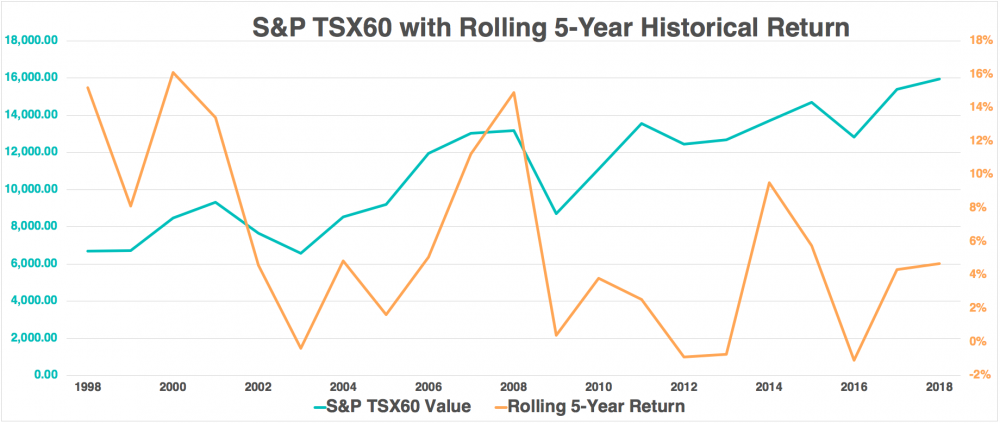
If this artificial price series seems too unrealistic, I’ve also replicated the same experiment using actual prices data from both the S&P 500 between the years of 1990 – 2018 and the S&P TSX60 with price data from 1988 - 2018. Again, we can see that high points in the historic rolling 5-year returns (in orange) correlated well with precipitous drops in the value of the market index. Also, investors who invested when historical returns were low were rewarded for their contrarian courage.
As you can see from the two diagrams above, there is a short window where the market’s rolling historical 5-year return is too high for a bank’s marketing team to ignore, given that their goal is to attract new business through visual advertising. You can’t really blame them either, because most clients would probably ignore any poster that displayed lackluster past returns, even though we have now proven that it might be in their best interest to take that information into consideration. The mathematical relationship between a cyclical market and its rolling 5-year returns, combined with basic phycological facts about human greed & fear offer us a complete model explaining why equities appeared so attractive to so many people at the worst possible time. No conspiracy theories required!